Introduction
In this guide I’m going to show you how to get familiar with the very basics of RStudio itself. We’re going to cover:
- The prerequisits (what you need before you start)
- What is RStudio? (brief)
- The RStudio layout
- Using RStudio
Prerequisites
You will need to have R and RStudio installed. You can follow this guide for base R installation and this guide for the installation of RStudio.
What is RStudio?
RStudio is an open-source software project and computer program that allows you to interact with the R computing language that you’ve previously installed on your system. RStudio provides you with a Graphical User Interface (GUI) that serves as a front-end which literally lies on top of R. RStudio is thus an IDE specifically for R.
The RStudio environment makes it easy for you to manage your projects and you will have everything that you need right at your fingertips. For instance, the GUI provides you with many of the well-known graphical elements such as navigation, menu items, preferences, file explorers etc. In RStudio, you will be able to easily manage your workflow in so-called R-projects (a collection of R files).
For me it is most important that my work is reproducable. With R & RStudio I can easily refresh that specific script containing an important analysis and I’m able to run that exact same analysis whenever I want. I can even plan the running of a script via Windows Task Manager to run daily. Write once and maintain, profit forever.
RStudio can be learned by anyone. It’s layout (default) is made up out of four different panels and rather intuitive. On the top left we have a source code editor packed with features (including syntax highlighting). On the top right we got the environment pane, which tells you what information you have currently stored in R in various objects. On the bottom left you will have the R console or terminal respectively. And on the bottom right you will find the explorer, help window, plot window and much more. Note that you can tweak your panel layout with ease.
RStudio layout
When you open up RStudio you immediately see four distinctive panes. All of which will be discussed here.
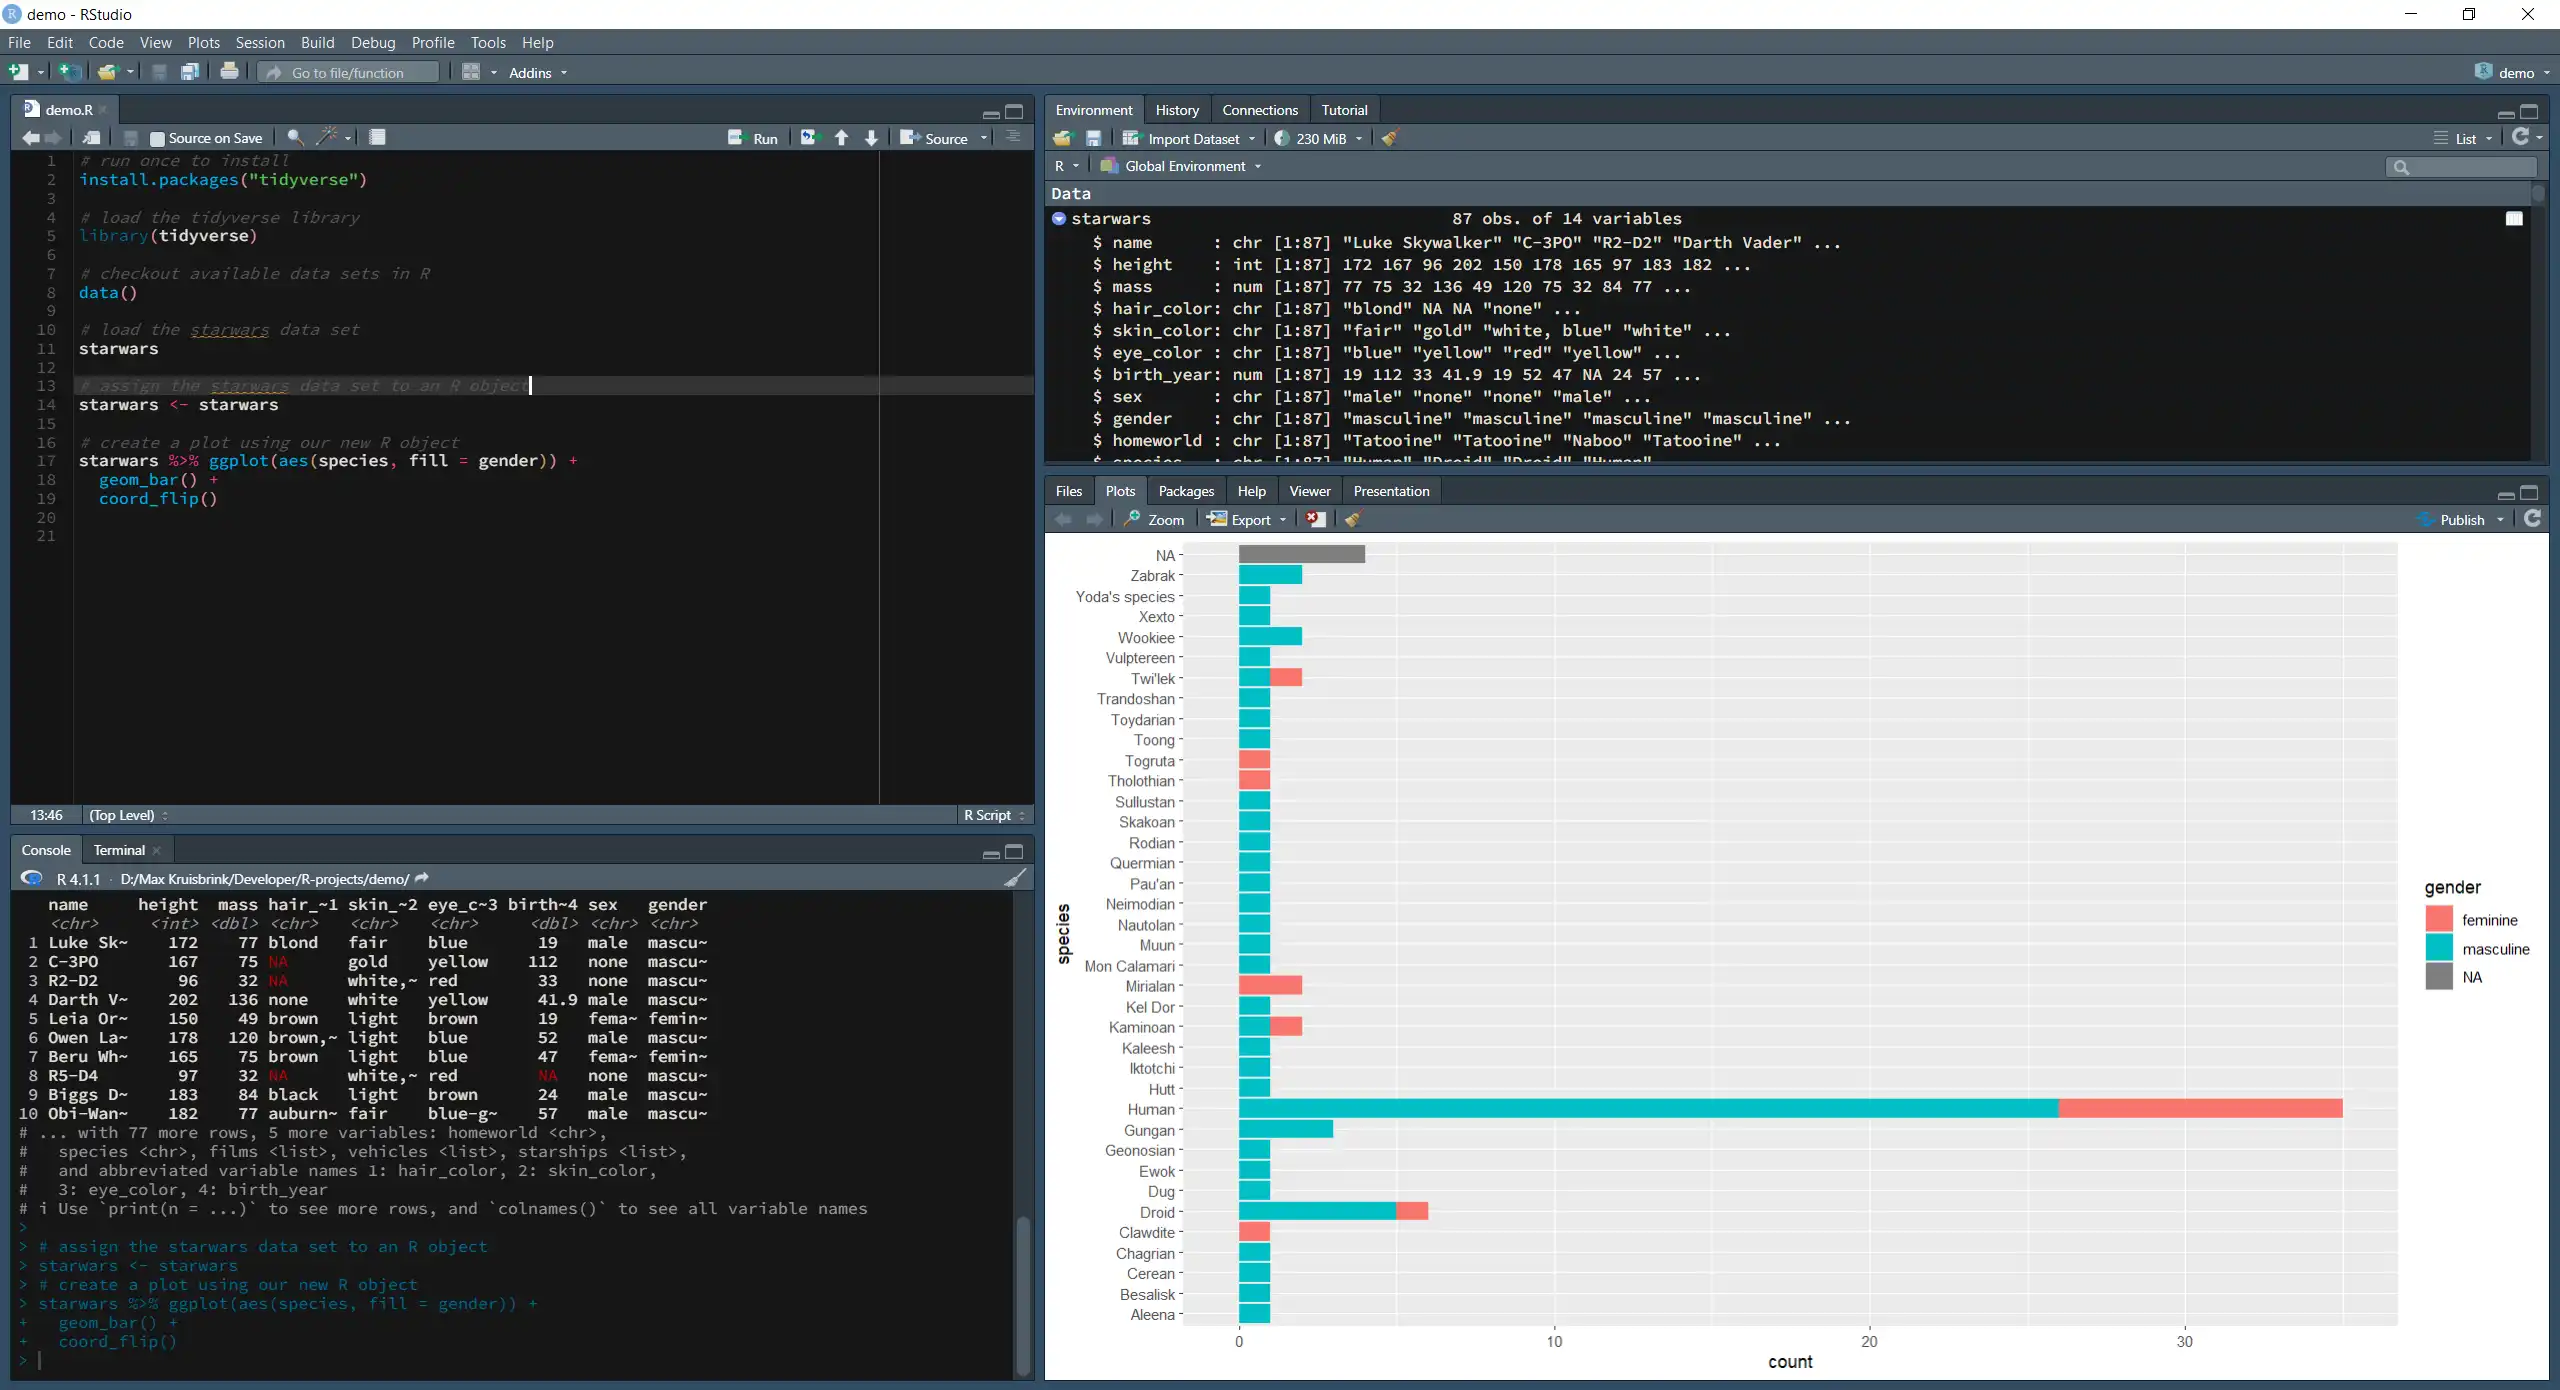
You can zoom in on every quadrant by using the following hotkeys:
| Where | What | Hotkey Command |
|---|---|---|
| Top-left | Source | <SHIFT> + <CTRL> + 1 |
| Bottom-left | Console & Terminal | <SHIFT> + <CTRL> + 2 |
| Top-right | Environment | <SHIFT> + <CTRL> + 3 |
| Bottom-right | Explorer & Viewer | <SHIFT> + <CTRL> + 4 |
You can return to the original viewport via <SHIFT> + <CTRL> + 0.
Script editor & data viewport
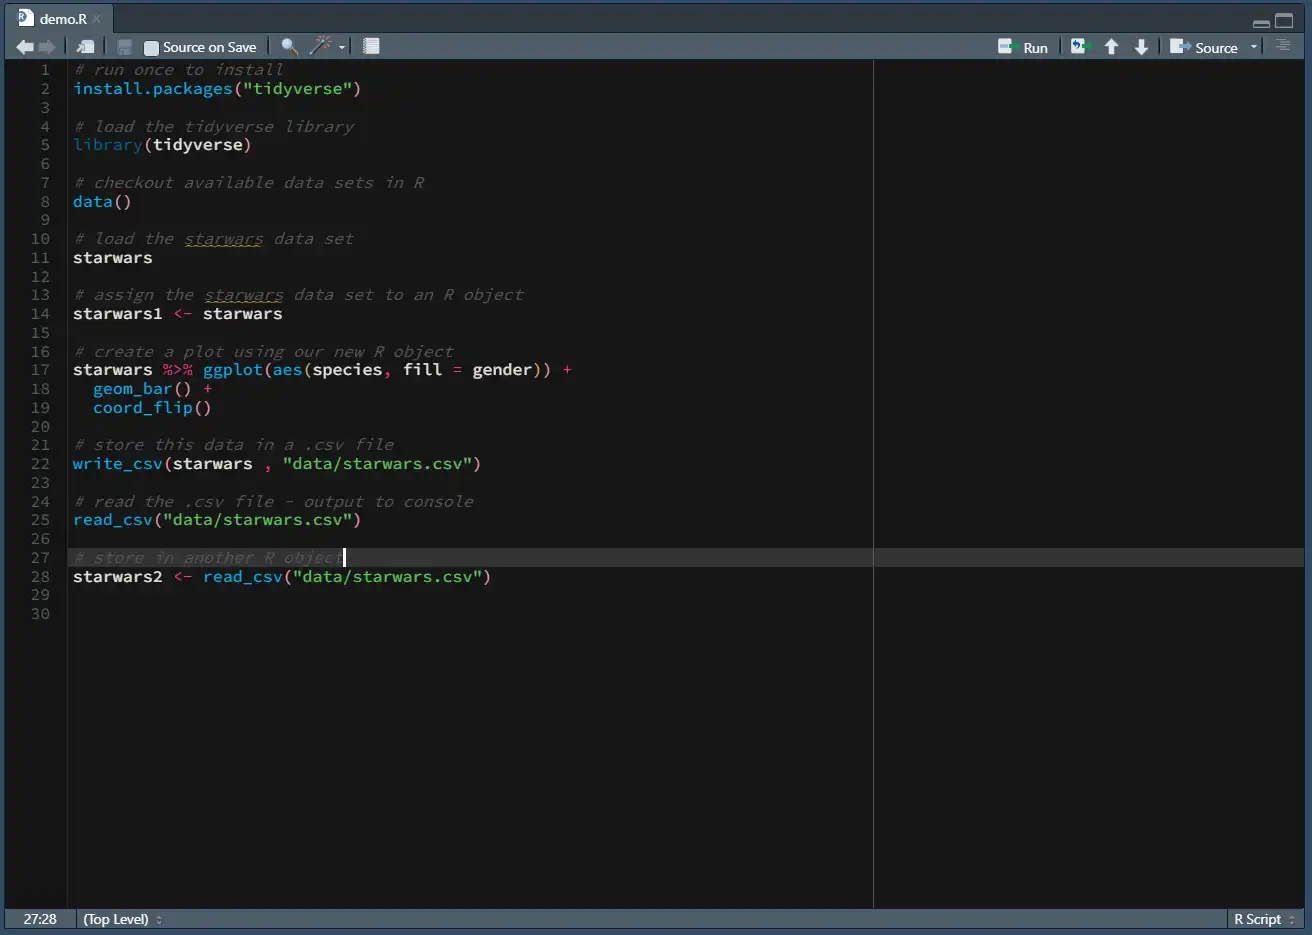
The top-left pane is where you will find the Script Editor and view your data(tables). The script editor is where you write your commands (code). These commands form a script and are provided to the R Console (bottom-left) as input. The Script Editor is an advanced text-editor which is designed for coding specifically.
Console & terminal
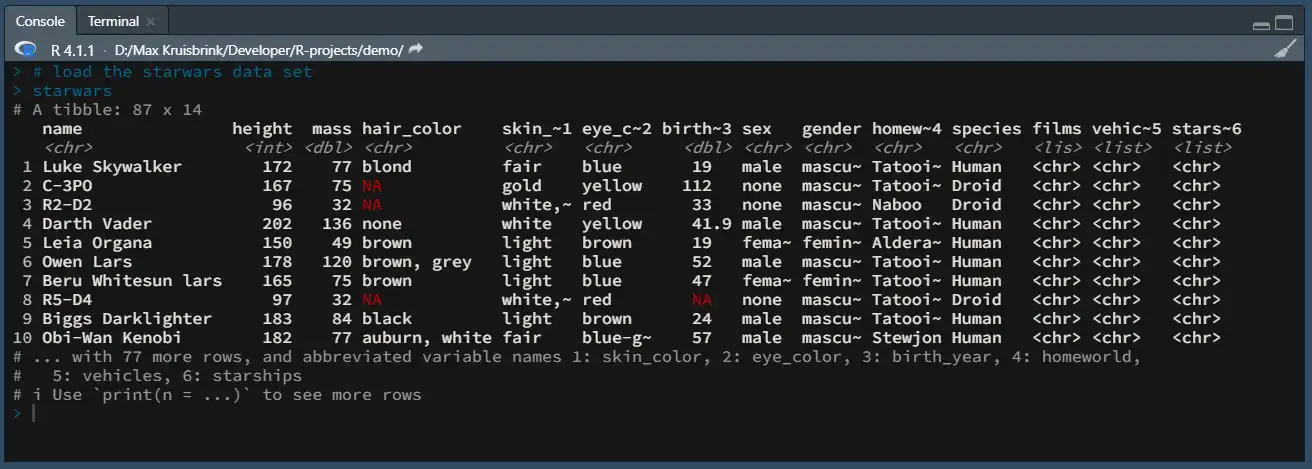
The bottom-left pane is where you will find the R Console. The Console is a viewport into R itself. RStudio takes your selected input (the code) when you click Run ![]() and submits it to R. Then… R does its magic and outputs to the Console. You can use the Console as a simple calculator or to run commands that you don’t want to include in your script. You will also find the terminal window in this pane, which you can use for navigation and other tasks (learning to use terminal will make your life easier).
and submits it to R. Then… R does its magic and outputs to the Console. You can use the Console as a simple calculator or to run commands that you don’t want to include in your script. You will also find the terminal window in this pane, which you can use for navigation and other tasks (learning to use terminal will make your life easier).
Environment & history
The top-right pane is where you will find the R Environment. The Environment is where RStudio stores all the inputs as objects. This can be data tables, lists, numbers etc. You can double-click on many of these objects to view them in your Script Editor (usefull for tables and data frames). In the History tab you will find all of the input you have provided to the R Console. In this case we see a dataframe called starwars, containing 87 observations of 14 different variables.
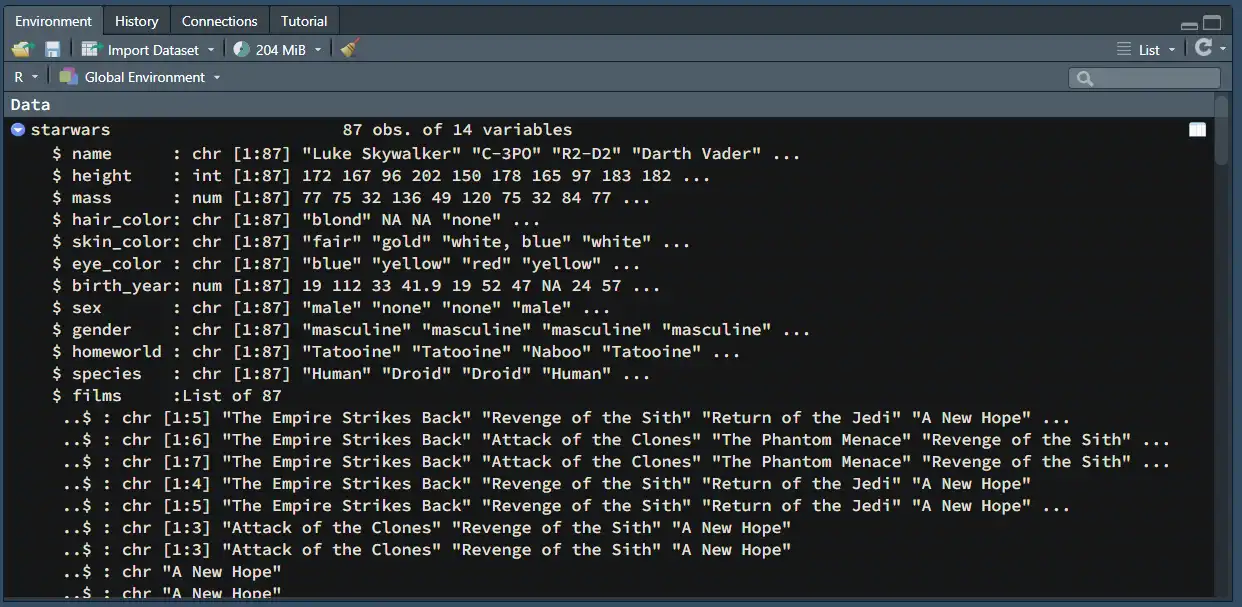
Note: You might also see Connections, Git and Tutorial, which are out of the scope of this introduction. Git is important but will be dealt with another time.
Files, plots, packages, help, viewer & presentation
The bottom-right pane is made up out of at least five tabs – Files, Plots, Packages, Help, and Viewer.
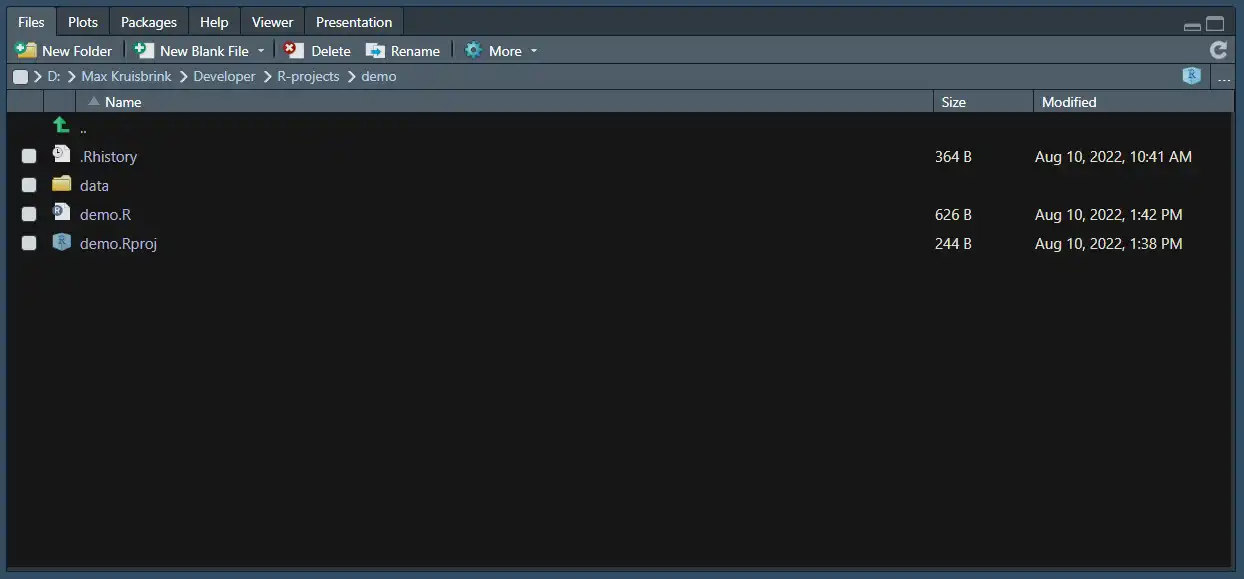
- The Files tab will show your current directory and allows you to quickly see your working files and folders. These are what make up your R project.
- The Plots tab will show the plots (graphics) produced by commands (your scripts) submitted to the Console.
- The Packages tab will show all of the currently installed packages on your system.
- The Help tab will show you usefull information regarding packages and functions. You can get help in a few ways:
- Click on a function you’re unsure about and press
F1 -
Type a
?before any object# obtain helpful information about an object ?starwars ?data() ?library ?`tidyverse-package`
- Click on a function you’re unsure about and press
- Some more advanced tabs that are not required for this introduction:
- The Viewer tab is used to display and output local web applications and content. If you are making an interactive application and you want to preview the results, this is where you would see your work.
- The Presentation tab is used for the creation of slides and presentations that make use of R code and is mostly used in classrooms or teaching in academia.
Using RStudio
You will use RStudio by creating so-called scripts in the Script Editor pane. Scripts are just simple text files that contain (R) code and you will submit your scripts to the Console for interpretation. R will then output graphical results to the Plot pane and textual or tabular content to the Console. If you specified in your R script to store data in variables, your data will be saved into objects in the Environment pane.
Creating your first R script
To create your first R script there are a few options:
- You open a blank file for an R script by selecting New File
 at the top-left and then selecting R Script
- Select the File menu and click the R Script
 option.
 - Simply press
<CTRL> + <Shift> + Nto create a new R script.
Note: Instead of a new R Script, create a new R Project
. You can think of an R project as a collection of files stored in a folder/directory that are all related. Information about the project is stored in a special
demo.Rprojfile. When you open your R Project, R magically starts in the correct folder and knows where to look for your scripts and data. You have everything you need in one place.
Creating your first R project
My advice is to create a new R Project to experiment and tryout new things as you learn about R. You will have all your experiments (scripts) in one place and you are implementing best-practices right from the start by working with R Projects. So let’s create that new Project.
- In the top-left of your screen, click on Create a project

- Or go to the File menu and select the New Project… option
- The New Project Wizard opens
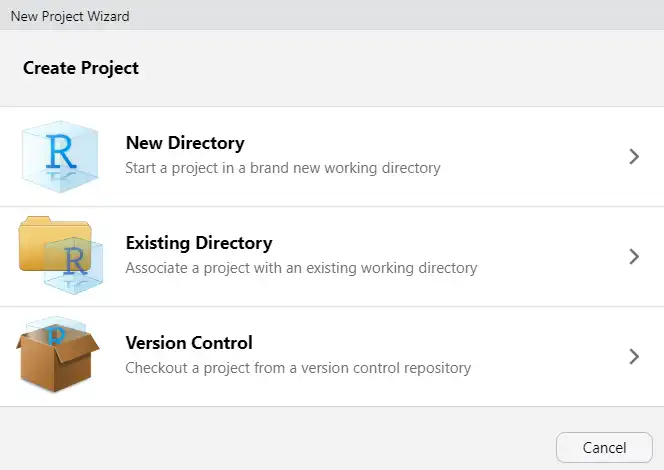
- If you already have a folder with some R scripts you can associate your Project with this directory. Select Existing Directory and provide the location of your folder containing R Scripts.
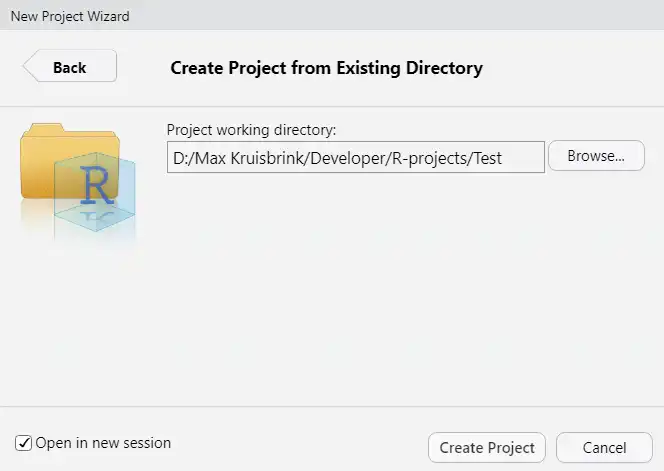
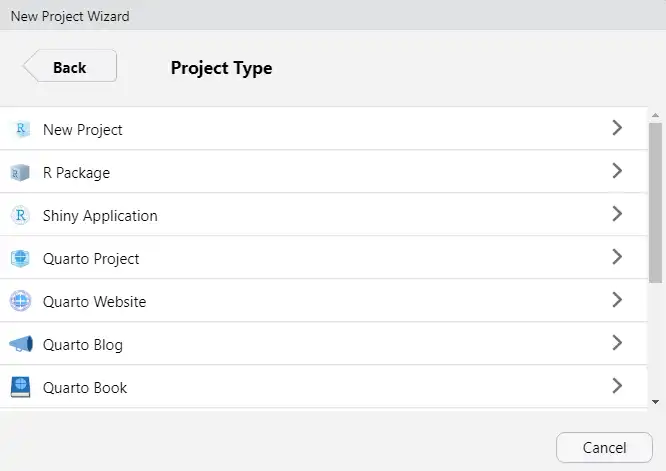
- Otherwise, select New Directory, click on New Project and in the next window provide both the name and location of your new directory as seen in below screenshots. You can uncheck the checkboxes for
gitandrenvfor this introduction. Check Open in a new session and click Create Project.
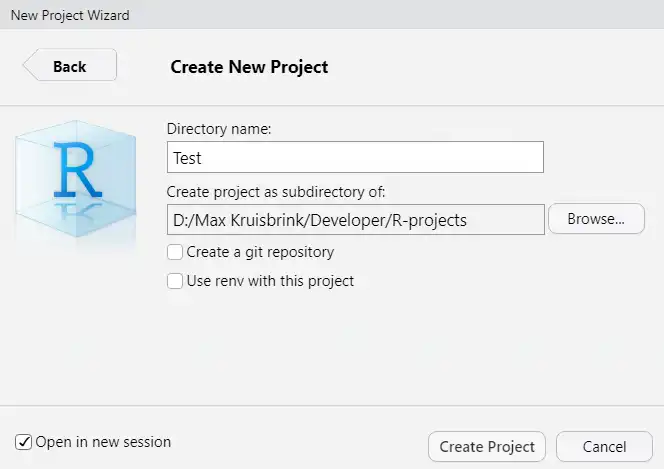
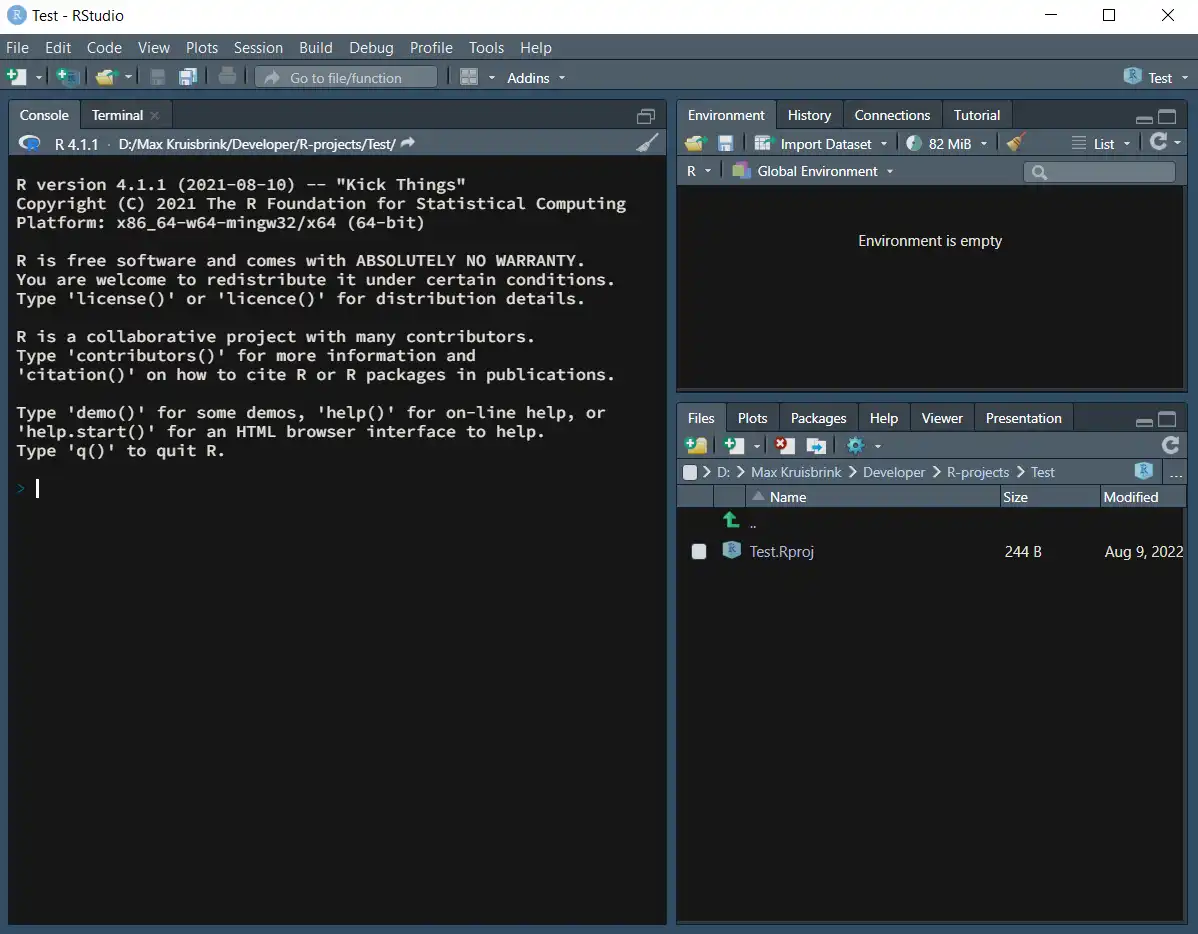
- Cool! Now you have created your first R Project! You’ll see your personal
Test.Rprojfile in the File explorer tab on the bottom right.
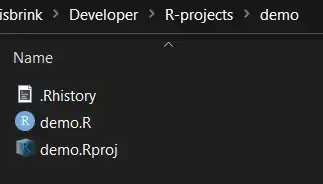
If you navigate to your project directory with the file explorer you’ll see the exact same thing, and you can start your R project by clicking on the demo.Rproj file. It will load your project with all relevant scripts and data and will know exactly in what location your project related files exist.
If you haven’t already, open up your new project and create a new script if you did not do so earlier.
Save your scripts!
I usually create a script and immediately save it afterwards with the Save ![]() command or
command or <CTRL> + <S> hotkeys. This might sound obvious but when you’re working in a new script it will be an untitled.R script living only in your Script Editor and your work is not saved to your local machine into your project directory before you save the file.
Installing R packages
R comes prepacked with a lot of functionality but the good thing about R is that it is open source and the global community has added tons of packages that you can install to expand the vocabulary that you can deploy.
We’re going to install and load a package called the Tidyverse. This package provides a whole lot of additional functionalities that you are going to use a lot. In your new R script, type:
install.package("tidyverse") #installs the package
library("tidyverse") #loads the package
- All text behind a ‘#’ character is considered to be a comment and will not be interpreted by R. I advise you to make use of comments from the start. It will help you understand earlier decisions.
- To run these lines of code you can use the Run
 command (
<CTRL> + <Enter>). This will run the current line or selection. - If you want to run the entire script, select everything with
<CTRL> + <A>and then press either<CTRL> + <Enter>or click the Run command after you made the selection.
You’ll see the package being installed via the R Console (you only have to install a package once!). You can also provide the install.package() function straight to your Console pane (this keeps your script lean).
Loading data into RStudio
Now we’re going to load some data. R comes prepacked with a bunch of dataframes that you can check out using the data() function.
#checkout available datasets
data() # and press <CTRL> + <Enter>!
I dont want to use these data though and because I like Star Wars I’m going to use another dataset that is provided by a package that comes with the Tidyverse that we just installed.
#starwars dataset
starwars # and press <CTRL> + <Enter>!
You will see the dataset in your R Console.
Saving data in R objects in RStudio
Now, in order to work with the data and to manipulate or change the data, we need to store it in an object. To store something in R you can use the assignment operator (<- with shortcut <ALT> + <-> or = with shortcut <ALT> + <+>). Let’s assign the starwars dataframe to an R object.
#starwars dataset
starwars # and press <CTRL> + <Enter>!

starwars_df <- starwars
Your RStudio window should look something like this:
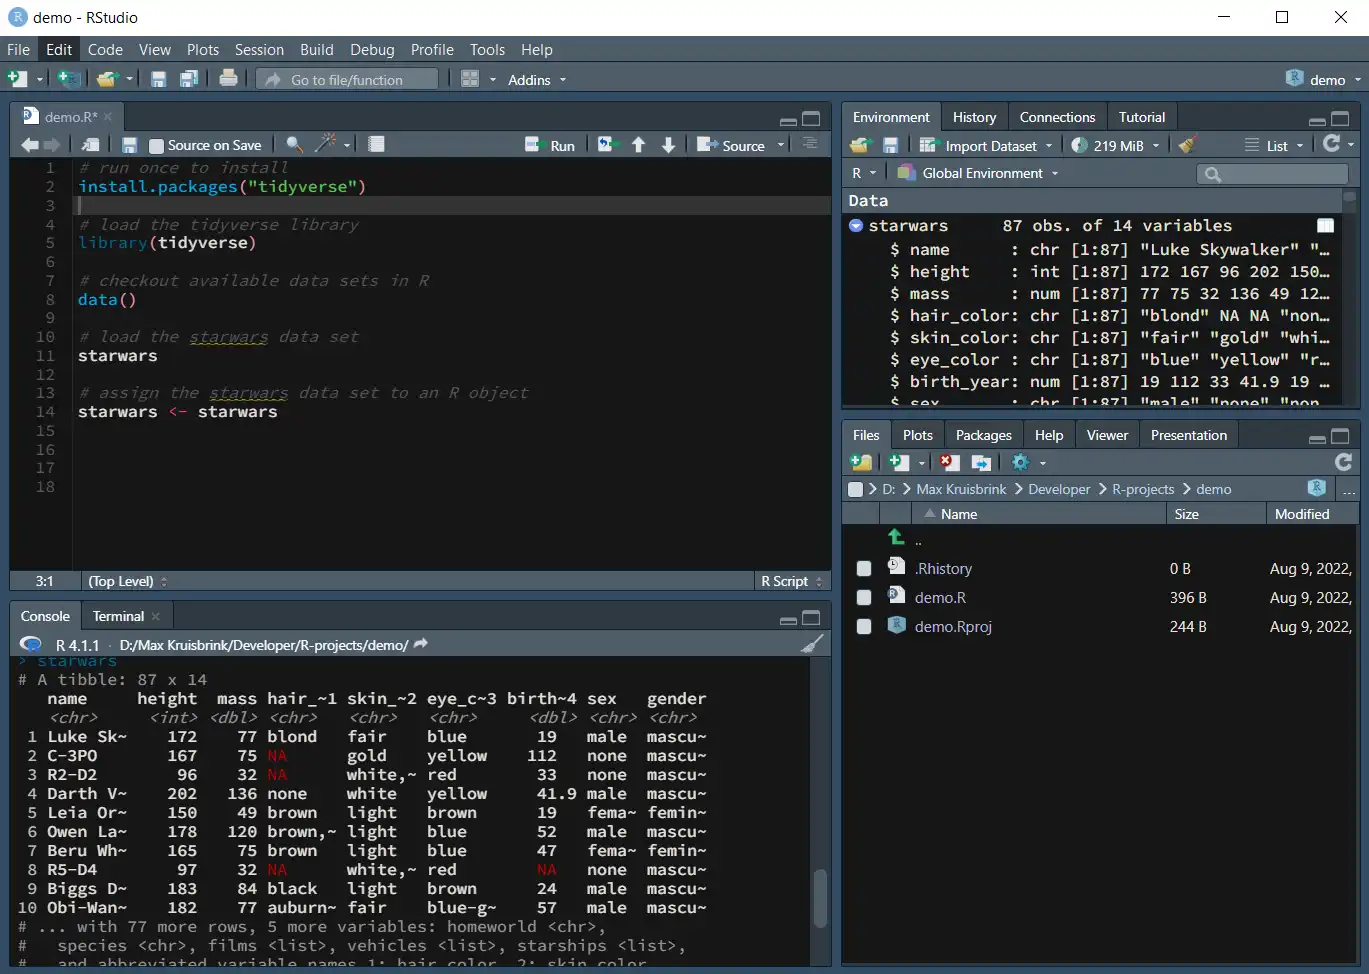
Visualizing data in RStudio
Let’s make a simple plot from data obtained from the starwars data set. For this, we’re going to use a function called ggplot(). In this little section of code we’re using a few functionalities from the tidyverse package. For the sake of the introduction I will not elaborate on these here.
# create a plot using our new R object
starwars %>% ggplot(aes(species, fill = gender)) +
  geom_bar() +
  coord_flip()
- We’re taking the
starwarsobject that we saved - We’re piping it (via the pipe operator
%>%) to theggplot()function - In the
ggplot()function we’re stating that we want to visualize the species on the x-axis, and fill (colour) by gender - Since there’s a lot of species and they don’t all fit on the horizontal x-axis, we’re swapping the axes.
The result looks like this:
 ></a>
></a>
As you can see, with just a few lines of code we were able to create a rather goodlooking graphic (but we barely scratched the surface). At this point you can import data into RStudio and play around with it.
Goodluck and have fun learning R and RStudio!
BONUS: R coding 101 with Greg Martin
This guy deserves a medal, be sure to checkout his YouTube page.